Photo: David Marcu, unsplash
Photo: David Marcu, unsplash
Promising news for markets…or micro-markets
News item: According to the Canadian Real Estate Association, national home prices have increased for six consecutive months.
That “news” is a generalization. It’s a snapshot of the overall picture, from coach to coast. In a business that focusses on micro-markets, it’s about a macro-market — Canada.
However, it raises an important and relevant issue. Where does the real estate market go from here?
As real-estate followers in the Lower Mainland well know, the market was in decline for many months and, for most of this year, has shown signs of levelling off, or finding a plateau where it has been — again generally speaking — neither up nor down.
 In Canada, B.C. is a micro-market. In B.C., the Lower Mainland is a micro-market. In the Lower Mainland, Vancouver is a micro-market. In Vancouver, the North Shore is a micro-market. In North Vancouver, Lynn Valley is a micro-market.
However, it raises an important and relevant issue. Where does the real estate market go from here?
As real-estate followers in the Lower Mainland well know, the market was in decline for many months and, for most of this year, has shown signs of levelling off, or finding a plateau where it has been — again generally speaking — neither up nor down.
In Canada, B.C. is a micro-market. In B.C., the Lower Mainland is a micro-market. In the Lower Mainland, Vancouver is a micro-market. In Vancouver, the North Shore is a micro-market. In North Vancouver, Lynn Valley is a micro-market. And so on. Where “the market goes” will differ from region to region.
As you continue to drill down, measuring market growth becomes even more specific. You have to consider an individual house in a micro-market, everything from how far it is from the nearest school to how many bathrooms it has to whether there’s a view, or privacy, or room to park the family cars.
All of a sudden, that micro-market becomes a micro-micro-market!
And then there’s the price.
Last month, one agent we know said more than 100 people attended an open house, for a property listed between $1 million and $1.2. Why? Probably because that is considered to be a level of affordability for many of the buyers looking to invest in real estate.
But when you ask “what’s next?” in the market, it’s a question that’s best answered by questions of probability.
Will falling interest rates prompt more people to buy?
Could the turmoil in Hong Kong send — as immigration expert Richard Kurland said last month — as many as half a million people to Canada, legally, and how many would wind up in B.C.?
Is the housing correction, as economists are declaring, really over and if it is, up to what price point — $1 million…$1.2 million...$1.5 million?
And does that implied correction apply to all types of housing — from apartments to condos to family homes to mansions?
The answers may be easier to find than six months ago, yet they’re still speculative.
Aren’t they?
The answers may be easier to find than six months ago, yet they’re still speculative.
Aren’t they?
Conflict of interest forbidden by real estate rules
Second of 2-part series
Except for the most unusual of circumstances, a realtor in B.C. is not allowed to participate in a transaction where he or she has a conflict of interest.
A “conflict of interest” occurs when one of the realtor’s clients wants to make an offer on a property belonging to another of the same realtor’s clients…or when two of the that realtor’s clients want to make an offer on the same property (regardless of the listing agent).
 The Real Estate Services Act rules stipulate that a realtor in either situation must:
The Real Estate Services Act rules stipulate that a realtor in either situation must: • stop acting for both clients, or
• ask both clients to sign an agreement in which the realtor continues to represent only one of them (both parties must sign off on that).
Those are the only two options.
The exception?
It’s called “dual agency” when one realtor represents the interests of two clients, and in B.C. it’s only permitted when the property is in a remote location that is under-served by real estate professionals, and when it’s impractical to enforce the rule.
Everywhere else in the province, a realtor must act only in one client’s best interests. Period.
If the two clients sign the agreement releasing the realtor to act for one of them (and remember, either client has the right to say no), the realtor is then still bound by legal duties pertaining to loyalty, confidentiality and avoiding conflicts.
For the “continuing client” the realtor must provide those duties without disclosing any confidential informing obtained from the “released client.” For the released client, the realtor can no longer provide advice and other duties required, but is bound to maintaining the confidentiality of information acquired while representing the released client.
Realtors have forms that explain conflict of interest in complete detail.
For further clarification on what to expect from your realtor when there is an apparent conflict of interest, or on anything you are entitled to expect from a realtor, call either Jennifer or Dale.


That there is a fresh Nexus Blog at least twice a week on the Nexus Realty website,
and that there’s a place for everyone to sign for the newsletter at the bottom of every page?
Stability the new normal from real estate stats?
Statistics released by the Real Estate Board of Greater Vancouver send a strong message that the market has at least stabilized and is showing signs of returning to continuing stability. In three words, sales are up. That is, “up” compared to the same time one year ago.
For all housing categories in the Greater Vancouver area, sales increased by 46.3 per cent last month, compared to September 2018. Breaking that down into the different types of housing for the same period, detached home sales are up by 46.7 per cent, attached homes by 53.5 per cent and apartments by 43.6 per cent.
For all housing categories in the Greater Vancouver area, sales increased by 46.3 per cent last month, compared to September 2018. Breaking
that down into the different types of housing for the same period, detached home sales are up by 46.7 per cent, attached homes by 53.5 per cent and apartments by 43.6 per cent. The Real Estate Board’s monthly news release — statistics for Vancouver West, Vancouver East, North Vancouver and West Vancouver are listed below), explained the current conditions this way:
“We’re seeing more balanced housing market conditions over the last three months compared to what we saw at this time last year. Home buyers are more willing to make offers today, particularly in the townhome and apartment markets.”
The sales-to-active-listings ratio for townhomes (attached homes) is 18.9 per cent and for apartments it’s 21.9 per cent. In the eyes of analysts, home prices experience upwards pressure when the ratio surpasses 20 per cent over several months.
With new listings at 4,866, that’s an increase of 29.9 per cent over the previous month (August 2019) and a 7.8 per cent decrease over a year ago (September 2018). One interpretation of that would be that the inventory is down from 2018 because there are more sales, and up over August 2018 because increased sales encourages more homeowners to list their properties.
Even with the sales increase, September sales were 1.7 per cent below the 10-year average.
The “benchmark prices” for all three types of housing continues to fall: $1.4 million for detached homes is down 8.6 per cent; $767,500 for attached homes is down 7.2 per cent; and $651,500 for apartments is down 6.5 per cent. All decreases are compared to benchmark prices from September 2018.
All are signs of the “new normal” that is stabilizing Greater Vancouver’s real estate market.
 “Jennifer produced a beautiful brochure with fabulous pictures, so lovely that we began to question whether we really wanted to sell! Dale and Jennifer were so good about keeping us organized and in the loop. Then at the open house, they were there all day answering questions and guiding folks around to show off all the good details. We received seven offers that day, and accepted one of them that night!”
 — Lois and Frederick Nash, North Vancouver
 From view properties: 13 cruise ships end the season
The cruise season in Vancouver is winding down. This is the last month until 2020 that you’ll be able to watch cruise ships — coming and going under the Lions Gate Bridge — from view properties and locations on either side of Burrard Inlet. There are just 10 days in October when that will happen and when the Star Princess departs on November 1, it will be the last cruise ship to visit Vancouver until next spring. The schedules of the 13 cruise ships you’ll see after September 30 are, as always, posted on the Nexus Realty website.Real Estate Monthly Statistics
The following statistics for West Vancouver, North Vancouver, Vancouver West and Vancouver East compare September 2019 to September 2018 (note: sales refers to number of sales, not to sale prices).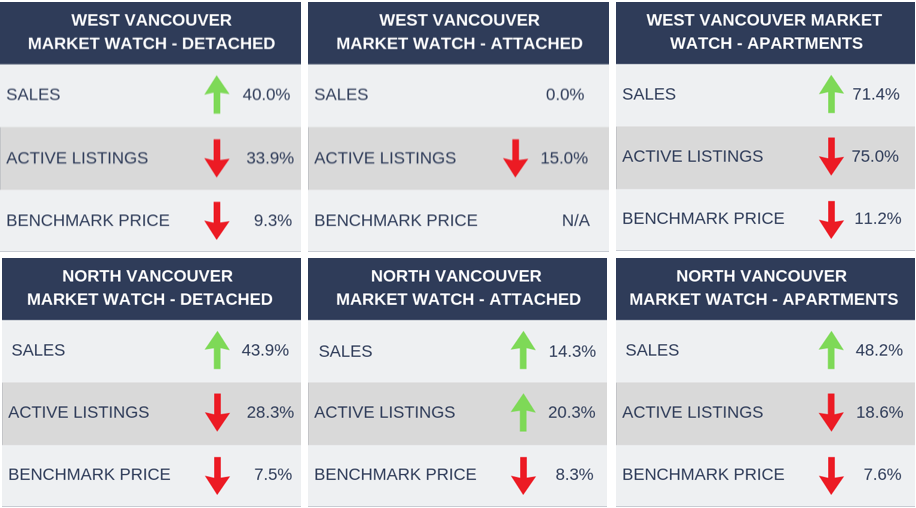
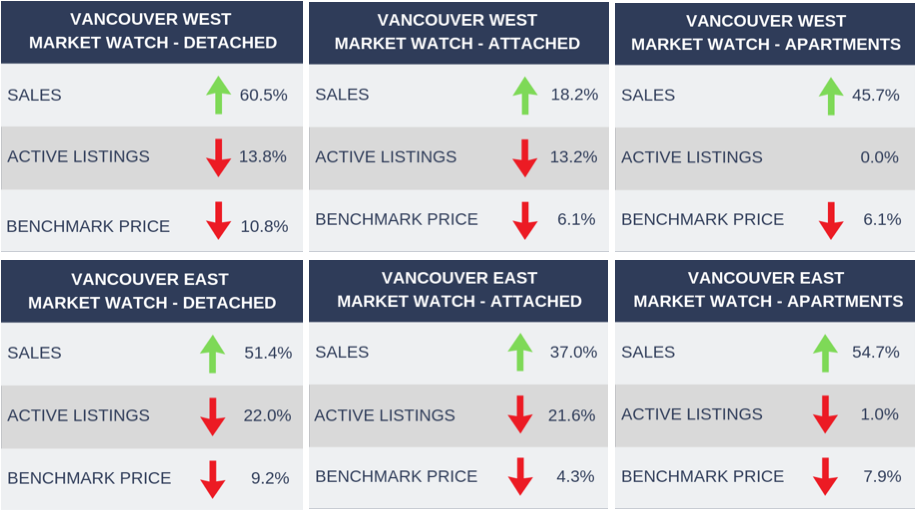
Benchmark Price: Estimated sale price of a benchmark property. Benchmarks represent a typical property within each market.
To see more information on local stats, please Click Here.

New Listing $700,000 Below Assessment!
2234 Palmerston Ave., West Vancouver