
Welcome to our Newsletter!
Our monthly newsletter is designed to address topics and subjects and statistics that are relevant to everyone in the Nexus market area, which essentially means the Lower Mainland. We distill facts, figures and opinions from the real estate world and pass along what we think will be most interesting to you. As always, we welcome your feedback and your questions, which perhaps will be addressed in future newsletters.
-- Dale and Jennifer

Home listings at four-year October high
Home sale activity across Metro Vancouver remained below long-term historical averages in October, according to the Real Estate Board of Greater Vancouver (REBGV). Residential home sales in the region totalled 1,966 in October 2018, a 34.9% decrease from the 3,022 sales in October 2017, but a 23.3% increase from September 2018, when 1,595 homes sold.Last month’s sales were 26.8% below the 10-year October sales average.
The supply of homes means home buyers have more selection, while sellers are facing more competition. It’s comparable to market conditions that haven’t existed for at least four years.
There were 4,873 detached, attached and apartment homes newly listed for sale on the Multiple Listing Service® (MLS®) in Metro Vancouver in October. This represents a 7.4% increase compared to the 4,539 homes listed in October 2017 and a 7.7% decrease compared to September 2018, when 5,279 homes were listed.
The total number of homes currently for sale on MLS® in Metro Vancouver is 12,984, a 42.1% increase from October 2017 (9,137) and a 0.8% decrease from September 2018 (13,084).
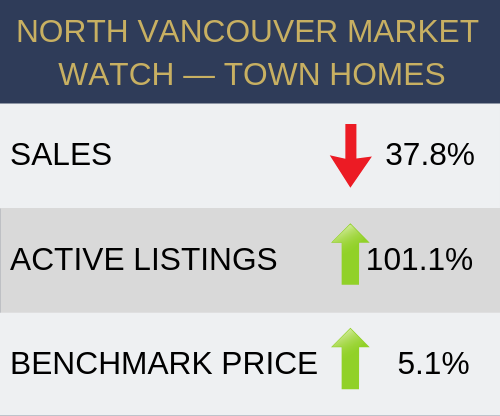
The sales-to-active listings ratio for October 2018 was 15.1% for all property types — 10.3% for detached homes, 17.3% for townhomes, 20.6% for condominiums.
Generally, analysts say downward pressure on home prices occurs when the ratio dips below the 12% mark, while upward pressure occurs when it surpasses 20%, in both cases for a sustained period.

Benchmark prices on the rise
The MLS® Home Price Index composite benchmark price for all residential homes in Metro Vancouver is currently $1,062,100, a 1% increase over October 2017 and a 3.3% decrease over the last three months.Broken down by housing type: detached homes sold in October 2018 was 637, a 32.2% decrease from October 2017. The benchmark price for detached properties is $1,524,000. This represents a 5.1% decrease from October 2017 and a 3.9% decrease over the last three months.
Sales of apartments was 985 in October 2018, a 35.7% decrease from October 2017. The benchmark price of an apartment property is $683,500. This represents a 5.8% increase from October 2017 and a 3.1% decrease over the last three months.
Attached homes sales in October 2018 totalled 344, a 37.5% decrease compared to October 2017. The benchmark price of an attached home is $829,200, a 4.4% increase from October 2017 and a 2.8% decrease over the last three months.

Rate hikes, regulatory changes moderating mortgage risk
by Ephraim Vecina, Mortgage Broker News
The recent interest rate hikes, along with the implementation of tighter mortgage rules, have moderated the risk of debt for a growing number of borrowers, according to a Bank of Canada research news release last week.
Many Canadians have adapted to these new realities and adjusted their spending accordingly. Credit growth also trended downward, which has alleviated widespread household vulnerability as a result.
“The number of new highly indebted borrowers has fallen, and overall mortgage activity has slowed significantly,” according to the study co-authored by BoC senior economist Olga Bilyk and researcher Maria teNyenhuis. “Tighter policies around mortgage qualification and higher interest rates are having a direct effect on the quality and quantity of credit.”
While the household debt-to-income ratios remain high, they are beginning to soften.
“It took a long time for that vulnerability to accumulate and it’s going to take some time for it to diminish,” BoC senior deputy governor Carolyn Wilkins explained to The Canadian Press.
“What we were hoping to see would be a continuing improvement in the quality of loans because what that does is, over time, put the economy on a more-solid footing.”
New high-leverage insured loans declined from 20% in late 2016 to 6% in the second quarter of 2018, and the proportion of high-leverage uninsured mortgages dropped from 20% a year ago to 14% as of Q2 2018.
The most-pronounced decline has been in the number of new mortgages for highly indebted borrowers, down by 39% in second-quarter comparisons of 2017 and 2018.
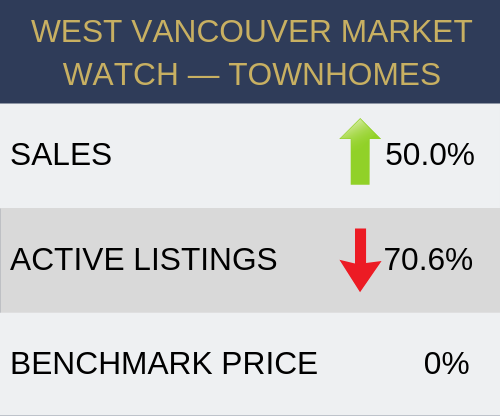
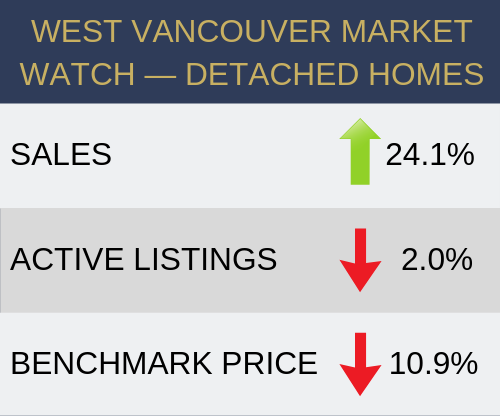
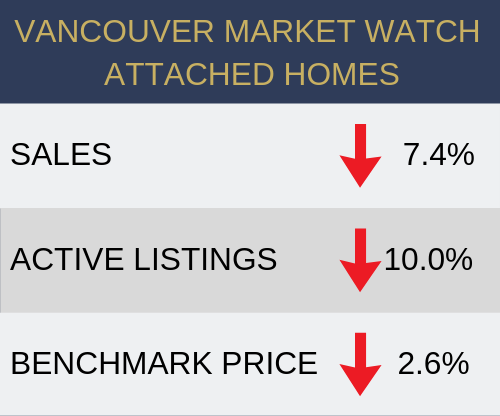
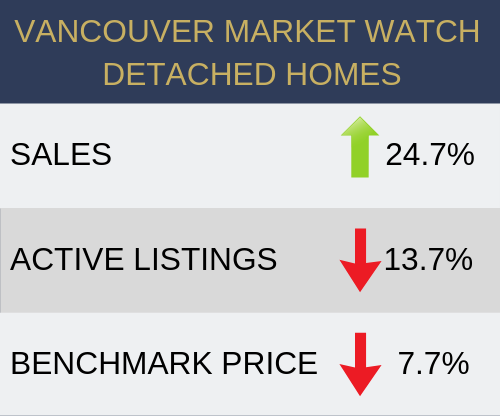
Stats are calculated comparing October 2018 to October 2017.
 \
\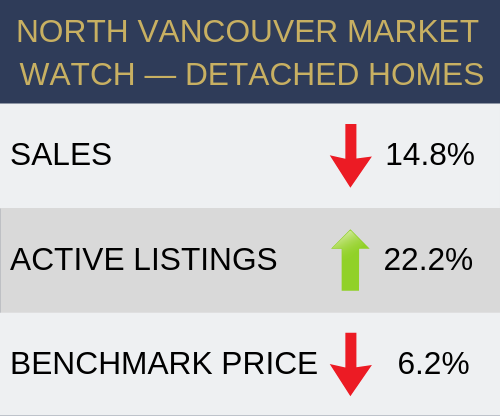
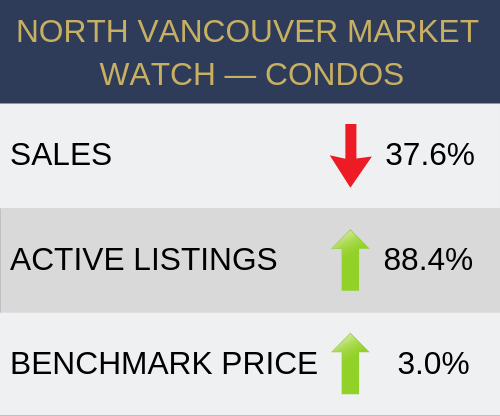
Benchmark Price: Estimated sale price of a benchmark property. Benchmarks represent a typical property within each market.