IN THE JANUARY ISSUE:
• 2020s: The corporate community look • Year-end review for Greater Vancouver real estate
• BC Assessments — some explanations • Toronto, Vancouver skew national sales average

The 2020s: corporate communities to grow?
This decade, the Twenties, is here. Its predecessor, a century ago, became the “Roaring Twenties.” Sandwiched between world wars, it was a decade of decadence — growth that turned silent movies into talkies, buggies into automobiles for the masses. Communication was principally newspapers and radio, and sports heroes and movie stars became celebrities. In that vibrant economy, real estate prices soared. While nobody knows if these Twenties will mirror that, there are theories about what neighbourhoods will look like over the next decade. In part three of a series about the 2020s, News From Nexus looks at the part corporations may play.
Third in a series
The buzz word for real estate in the 2020s may turn out to be “placemaking.” By definition, it is a multi-faceted approach to planning that, among other things, makes use of under-utilized space to address the habits of the locals.In the Lower Mainland, that may mean re-tooling a community, or building new ones, to accommodate what is a growing population. It may mean 90 per cent occupancy and building more density to try and deal with affordability.
Where do corporations come in?
If what’s happening elsewhere in the Western World is an indicator, there will be more “landlords” of the corporate kind. In a trend that began in (and has now returned to) the U.S., corporations are developing “build-to-rent” homes to address affordability, specifically the needs of young professionals who have been priced out of ownership.
Corporate investment groups may be funded by investors who are looking for stable returns — such as pension funds. To make such communities attractive, things like entertainment centres, retail stores, restaurants, daycares and supermarkets can go a long way to creating a neighbourhood that becomes more and more self-contained…all of it controlled by corporate ownership.
The number one driver in real estate development is the shortage of housing, the supply and the demand. This kind of development will affect the alternatives available to both renters who don’t have the resources to own and to the buyers who do. Long-term renting is a long-standing staple on lands owned by the First Nations, and continues.
Densification is already underway throughout the Lower Mainland, and the corporate world is well aware of the opportunities that come with densification. If corporations are going to get heavily involved, they want to be good corporate citizens…good landlords.
There is space to be developed, even in downtown Vancouver. Check under the Granville Street Bridge, where pie-shaped buildings now reach
 up through the space between ramps on and off the bridge, and are grounded in an area that has the makings of being a “chic” attraction of shops, cafes and retail outlets.
Think not? Well, the developer thought enough of it to suspend a work of art — called Spinning Chandelier — under the bridge, at a cost of $4.8 million!
Next month: Construction of homes, 2020s style

BC assessments for taxes, not market value
What you need to know about the property assessments the provincial government sends out this month is that they:• are calculated for tax purposes
• are six months old by the time you receive them
• will be 18 months old when you await your next assessment, in December 2020
• reflect the assessed value of the property, not the current market value
In December, the government previewed its 2020 property assessments by saying in a press release: “When properties similar to your
 roperty are sold around July 1, those sales prices are used to calculate your assessed value…to make sure your assessment is fair and accurate as compared to your neighbours.”
The cut-off date for property assessments is July 1 each year. The assessments are finalized and mailed out on January 2 each year. That means a property assessment done on July 1, 2019 stands until January 1, 2021.
For tax purposes, that is.
So while assessments are based on market conditions, they're old market conditions. If the market has been stable since the assessment, the assessed figure could be close to the property’s market value. It could also be substantially higher…or lower.
Market value is determined by what similar houses are selling for at that time. Chances are the changes in assessment have already been reflected in selling prices by the time of the transaction.
Property assessors calculate property values for tax purposes, based on the past. They are not allowed to speculate about future market conditions.
If your property assessment has dropped since January 2, 2019, that doesn’t necessarily mean your home is worth less — what has the market done in the months since the assessment was calculated?
Assessments also vary according to where you live. For example, according to BC Assessment’s reliminary figures, single-family homes on the North Shore could have a drop of up to 15 per cent in assessed value, while single-family homes in Kamloops could have an increase of up to 10 per cent.
The best way to determine the true value of your home is to consult your realtor, who will do all the research necessary to produce the most up-to-date “assessment.”

What our clients are saying...
“Dale and Jennifer marketed our home in its best possible light, producing stunning brochures and out-of-district advertising, using both hard copy and electronic methods for highlighting our property. Jennifer provided regular updates and statistics, using the latest technological methods. They found a buyer in less than two weeks and were instrumental in securing a creative agreement that fit our conditions perfectly.”— Mary and Alex Baker, Roberts Creek

REBGV: comparisons for year-end and December
The final days of December (or first days of January) always brings a variety of “year-end” reports in many walks of life, real estate among them.So the Real Estate Board of Greater Vancouver (REBGV) reflected on 2019 as a whole and discovered that:
• the second half of the year was more active than the first half
• sales were up slightly and inventory was down slightly over the previous year
• the 2019 figures were, like 2018, below the 10-year sales average
• benchmark prices dropped less for townhomes (2.4 per cent) than they did for apartments (2.7 per cent) or detached homes (4 per cent)
REBGV said this in its monthly statement:
“We didn’t see typical seasonal patterns in 2019. Home buyer demand was quieter in the normally busy spring season and it picked up in the second half of the year. Prices dipped between two and four per cent across the region last year depending on property type.”
As for monthly comparisons, residential home sales increased by 88.1 per cent last month compared to December 2018 and decreased by 19.3 per cent compared to the previous month, November 2019. Similarly, more homes were new to the market this December than last (by 12.9 per cent) and fewer than in November 2019 (by 46.8 per cent).
In all three home categories — detached, townhomes and apartments — the difference in sales from November was less than one per cent. That would seem to indicate, as analysts have been saying, that the market is at least more stable.
Also, for the second consecutive month, the sales-to-active listings ratio in all three residential home categories indicates upward pressure on home prices. It was 23.4 per cent for all property types — 15.2 per cent for detached homes, 25.7 per cent for townhomes and 32.5 per cent for apartments.
Analysts say that downward pressure on home prices occurs when the ratio dips below 12 per cent for a sustained period, while home prices often experience upward pressure when it surpasses 20 per cent over several months.
In all, this month’s report is a little bit of a mixed bag that indicates a lot of stability.

That while the Canadian average home price has been calculated at $525,000, if you eliminate Vancouver and Toronto from the calculation, the national average home price drops to $400,000, and that — according to the Canadian Real Estate Association — the corresponding yearly increase goes from 5.8 per cent to 4.7 per cent, respectively?

Real Estate Monthly Statistics
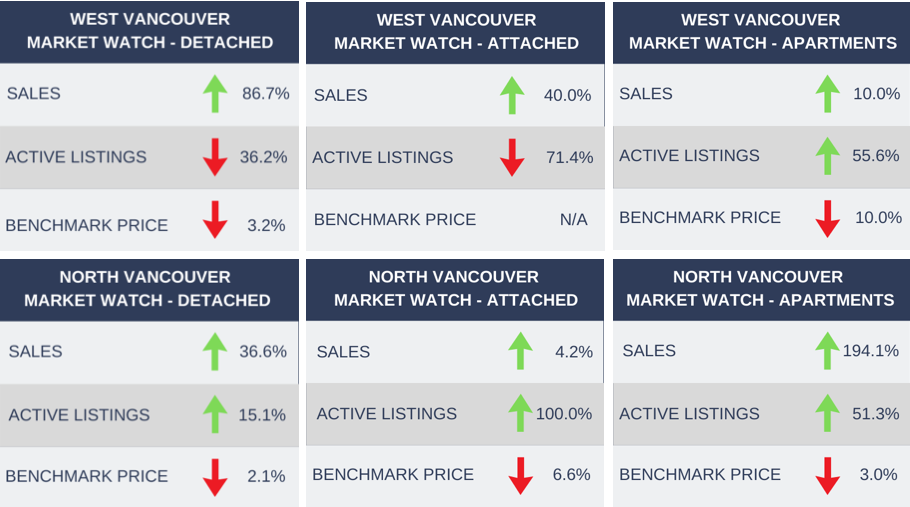
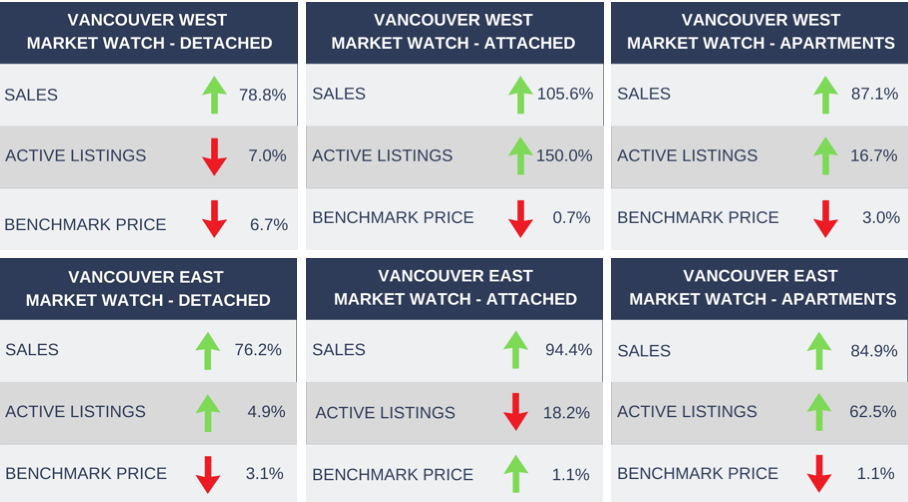
The following statistics for West Vancouver, North Vancouver, Vancouver West and Vancouver East compare December 2019 to December 2018 (note: sales refers to number of sales, not to sale prices).


Benchmark Price: Estimated sale price of a benchmark property. Benchmarks represent a typical
property within each market. To see more information on local stats, please Click Here.


