Following the release of its monthly statistics last week, the Real Estate Board of Greater Vancouver provided members with a report that drilled deeper. The monthly message from REBGV was that the market conditions are returning to more “traditional” levels.
The two graphs below indicate how close the markets for Metro Vancouver and West Vancouver are to being balanced, using the sales-to-active listings ratios as the benchmark. The graphs all show where the market has been — for detached homes, townhomes and condos (apartments) over the past two years.
Here is for the graph for all of Metro Vancouver:
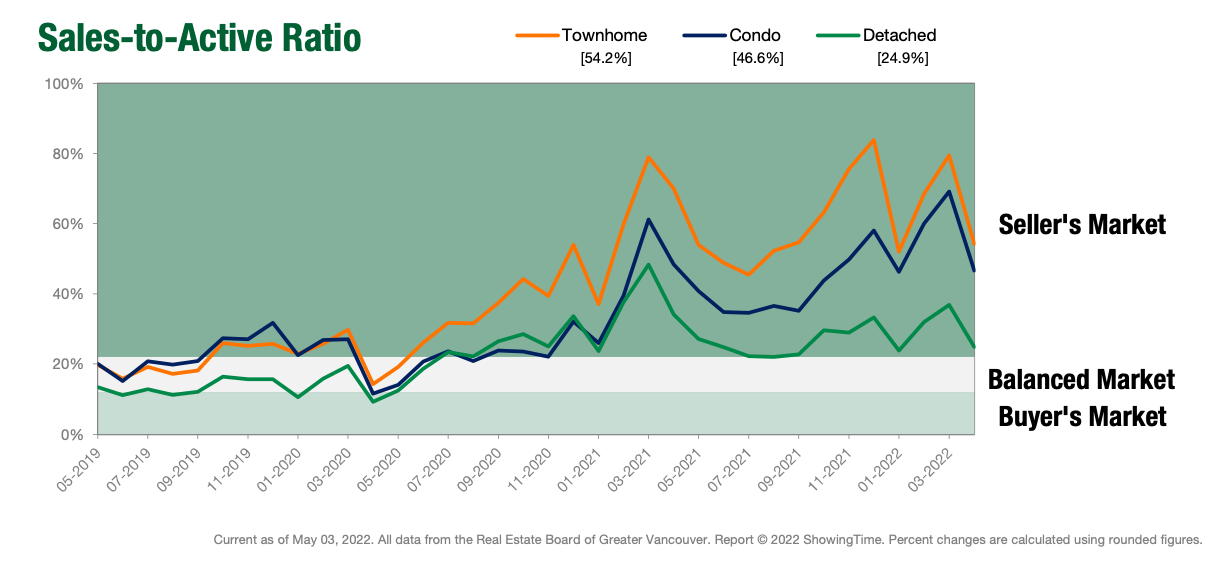
All three categories, while becoming more traditional, indicate that Vancouver is still a “seller’s market” according to the right side of the graph (as of May 3).
Here is for the graph for West Vancouver:
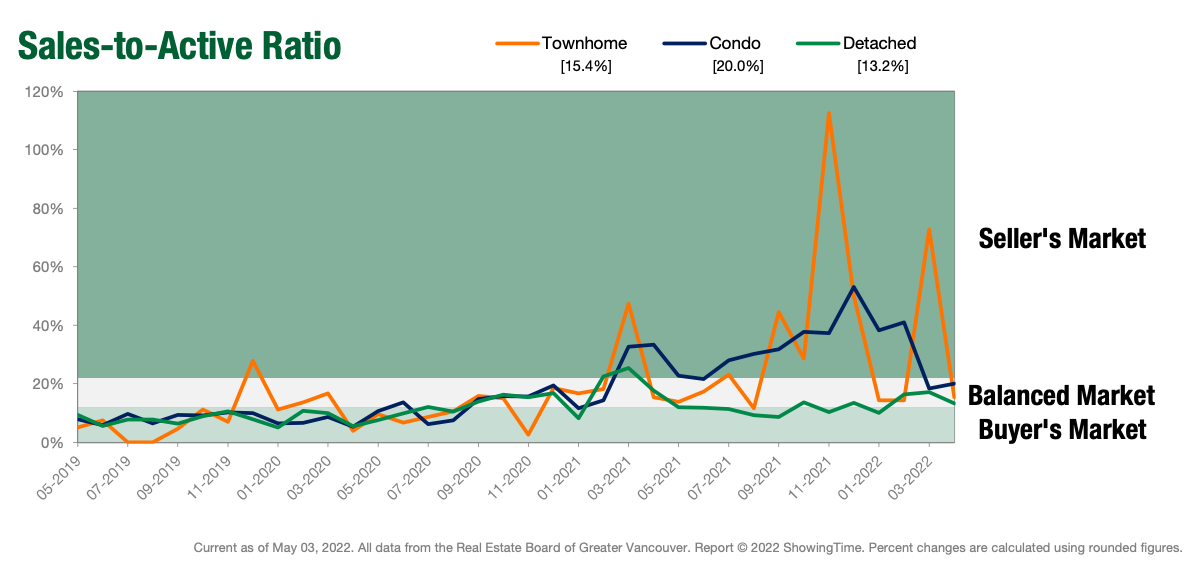
As you can see by the latest statistics for all three categories, West Vancouver is now considered to be in a “balanced market” also as of May 3 (right side of the graph). The window that represents a balanced market is the white background: when the sales-to-active listings ratio is between 12 per cent and 20 per cent.
This is just a snapshot. Generally, analysts say downward pressure on home prices occurs when the ratio dips below 12 per cent for a sustained period, while home prices often experience upward pressure when it surpasses 20 per cent over several months.