
You may notice a few additions to our newsletter this month — comments from clients and a way for you to see what cruise ship is
sailing past properties with views of waterways leading to Vancouver. We’re always looking to add content we think you’ll find
interesting, from a real estate perspective. And we always include real estate statistics (courtesy of the Real Estate Board of Greater
Vancouver) and articles that are relevant. As always, let us know what you think.
 Micro markets tell the real story of stats
The real estate statistics you see here every month are just the first step in analyzing what is happening in your market area, and how they can be used whether you’re buying or selling a home. The real story is in the “micro markets.”
Within each market that makes up “Vancouver” there are micro markets.
For example, does what’s happening in the market in Mission accurately reflect what’s happening in White Rock? Both are in the Fraser Valley real estate market, which is part of the Vancouver area, but they’re in a different part of the Metropolitan area that forms the basis for the Real Estate Board of Greater Vancouver’s statistical analysis. In February, as an example, the market was up in the Fraser Valley and down in Vancouver, but both boards are considered to be part of the Vancouver region.
So you have to drill down. You have to get a more accurate statistical analysis of what’s happening in your neighbourhood, your micro market.
You have to analyze the market in your area to find out how your property relates to that market. You need a realtor who is experienced at analyzing micro markets to give you a more educated idea, and that's what we do with all our clients.
In other words, don’t set the price of your property — or make an offer on one you want to buy — based on the statistics you see for “real estate in Vancouver.”
Drill deeper.
Why pay attention to the monthly stats at all?
Because they provide you with a general idea. Every month, we break down the REBGV statistics into four areas — Vancouver West, Vancouver East, North Vancouver and West Vancouver. Even within those four districts there are micro markets.
You have to start somewhere, and the broad monthly statistics are a good place to start. Put it this way: If you went to the doctor and discovered you had high blood pressure, the doctor isn’t going to stop there, but is probably going to drill down to find out the cause, or the proper medication to treat it. High blood pressure is the starting point.
It’s the same with the real estate statistics — they’re the starting point for finding out what’s really happening in the micro markets.
About those cruise ships…

If you’re looking at one (or looking out from) one of those wonderful, scenic view properties that cruise ships sail past at this time of year, you just might be interested in knowing what you’re seeing — or what that ocean view is worth in real estate terms.
Check out the ship arrival and departures on our website, where we have a complete list for April and May, the start of the cruise season, along with links that will tell you more about the cruise ship you’re watching.
You’ll find a link to the list of ships on the Nexus home page.
Check out the ship arrival and departures on our website, where we have a complete list for April and May, the start of the cruise season, along with links that will tell you more about the cruise ship you’re watching.
You’ll find a link to the list of ships on the Nexus home page.
Real estate board fingers governments for sales drop
 In its monthly press release accompanying statistical data from March, the Real Estate Board of Greater Vancouver reported more drops in residential home sales and clearly pointed to government intervention as a major cause.
 Here is what the REBGV says:
“The market trends we’re seeing are largely policy induced. For three years, governments at all levels have imposed new taxes and borrowing requirements on to the housing market. What policymakers are failing to recognize is that demand-side measures don’t eliminate demand, they sideline potential home buyers in the short term. That demand is ultimately satisfied down the line because shelter needs don’t go away. Using public policy to delay local demand in the housing market just feeds disruptive cycles that have been so well-documented in our region.”
As the organization that regularly analyzes real estate sales for all of Metro Vancouver, the REBGV reports that March home sales were at the lowest level in three decades. Residential home sales in the region totalled 1,727, a 31.4 per cent decrease from the 2,517 sales recorded in March 2018, and a 16.4 per cent increase from the 1,484 homes sold in February 2019.
It was also 46.3 per cent below the 10-year March sales average.
On the other hand, there is an increase in homes listed for sale — 52.4 per cent more than March 2018.
The figures apply to all property types — detached residential homes, townhomes and apartments.

Government plans to help first-time home buyers

 When the federal budget was unveiled last month, it included an attempt to address the Canadian housing market by making homes more affordable for first-time home buyers through SEMs — Shared Equity Mortgages — that would give Canada Mortgage and Housing Corporation (CMHC) up to a 10 per cent investment in the homes.
 One of the stories that examined the likelihood of success for SEMs was in the Financial Post. While it’s still premature because the Federal Government will release terms of the SEM plan later, this was the headline in the Post’s story:
Shared equity mortgages, like those in federal budget, no cure-all for housing affordability woes
To read the entire analysis by writers Murtaza Haider and Stephen Moranis click here:
Shared equity mortgages, like those in federal budget, no cure-all for housing affordability woes
To read the entire analysis by writers Murtaza Haider and Stephen Moranis click here:
Nexus Note: For a program to address the “stress test” that you’ve read about in our previous newsletters, the government still needs to find more of a middle ground, especially for markets like Vancouver. Stay tuned.

Real Estate Monthly Statistics
The following statistics for West Vancouver, North Vancouver, Vancouver West and Vancouver East compare
March 2019 to March 2018 (note: sales refers to number of sales, not to sale prices).

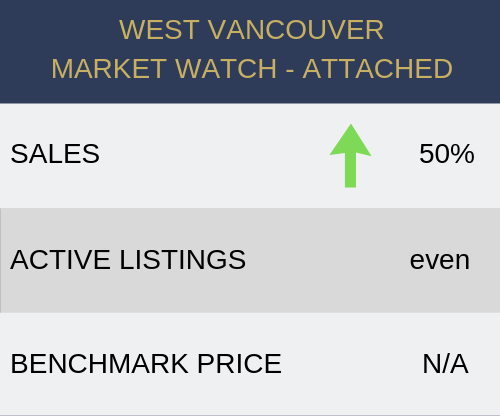
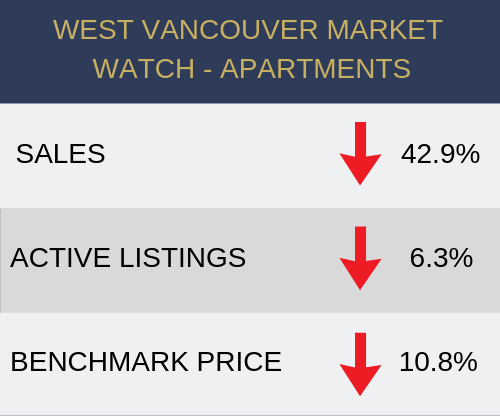
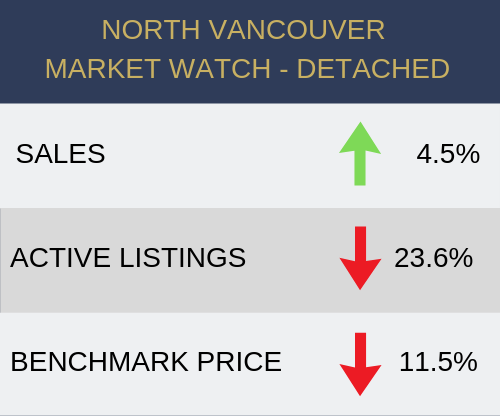
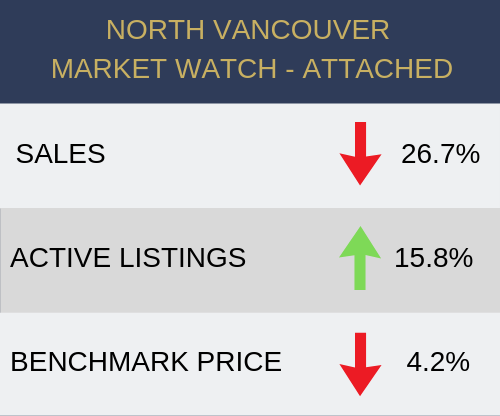

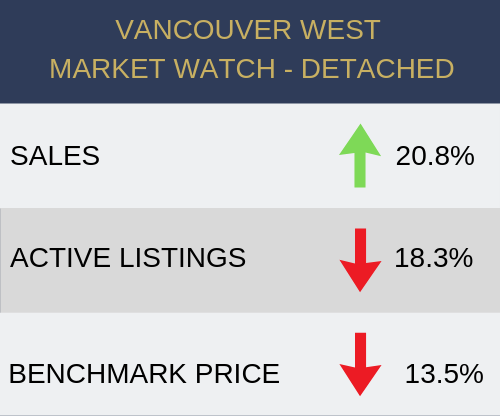
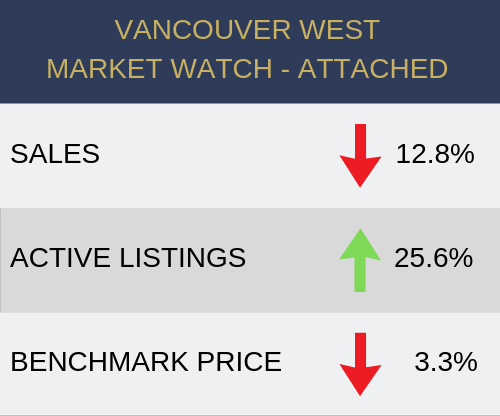
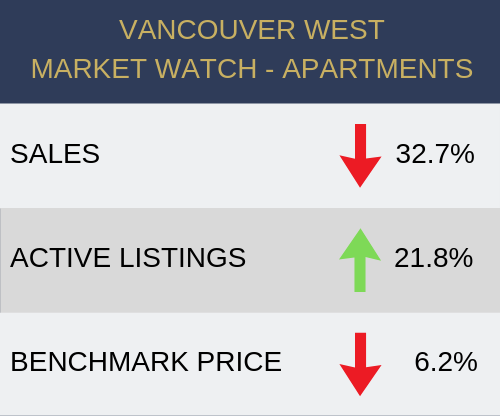
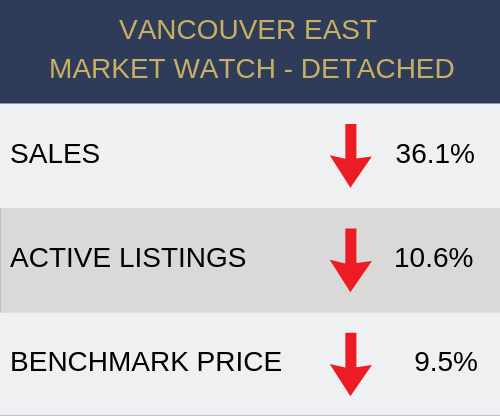
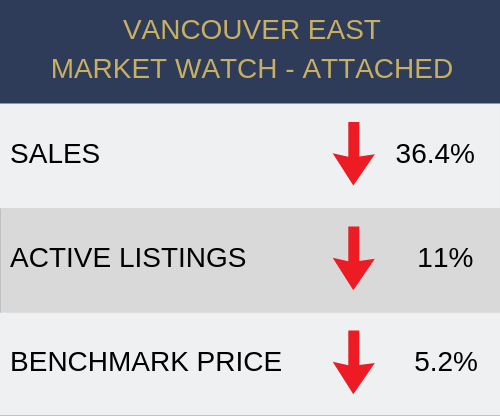
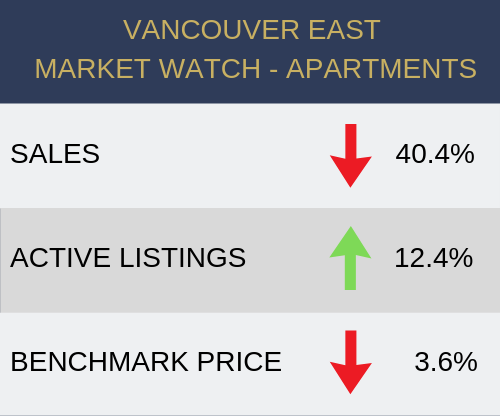
Benchmark Price: Estimated sale price of a benchmark property. Benchmarks represent a typical property within each market.
To see more information on local stats, please CLICK HERE.